1
Standard Wood Frame
Baseline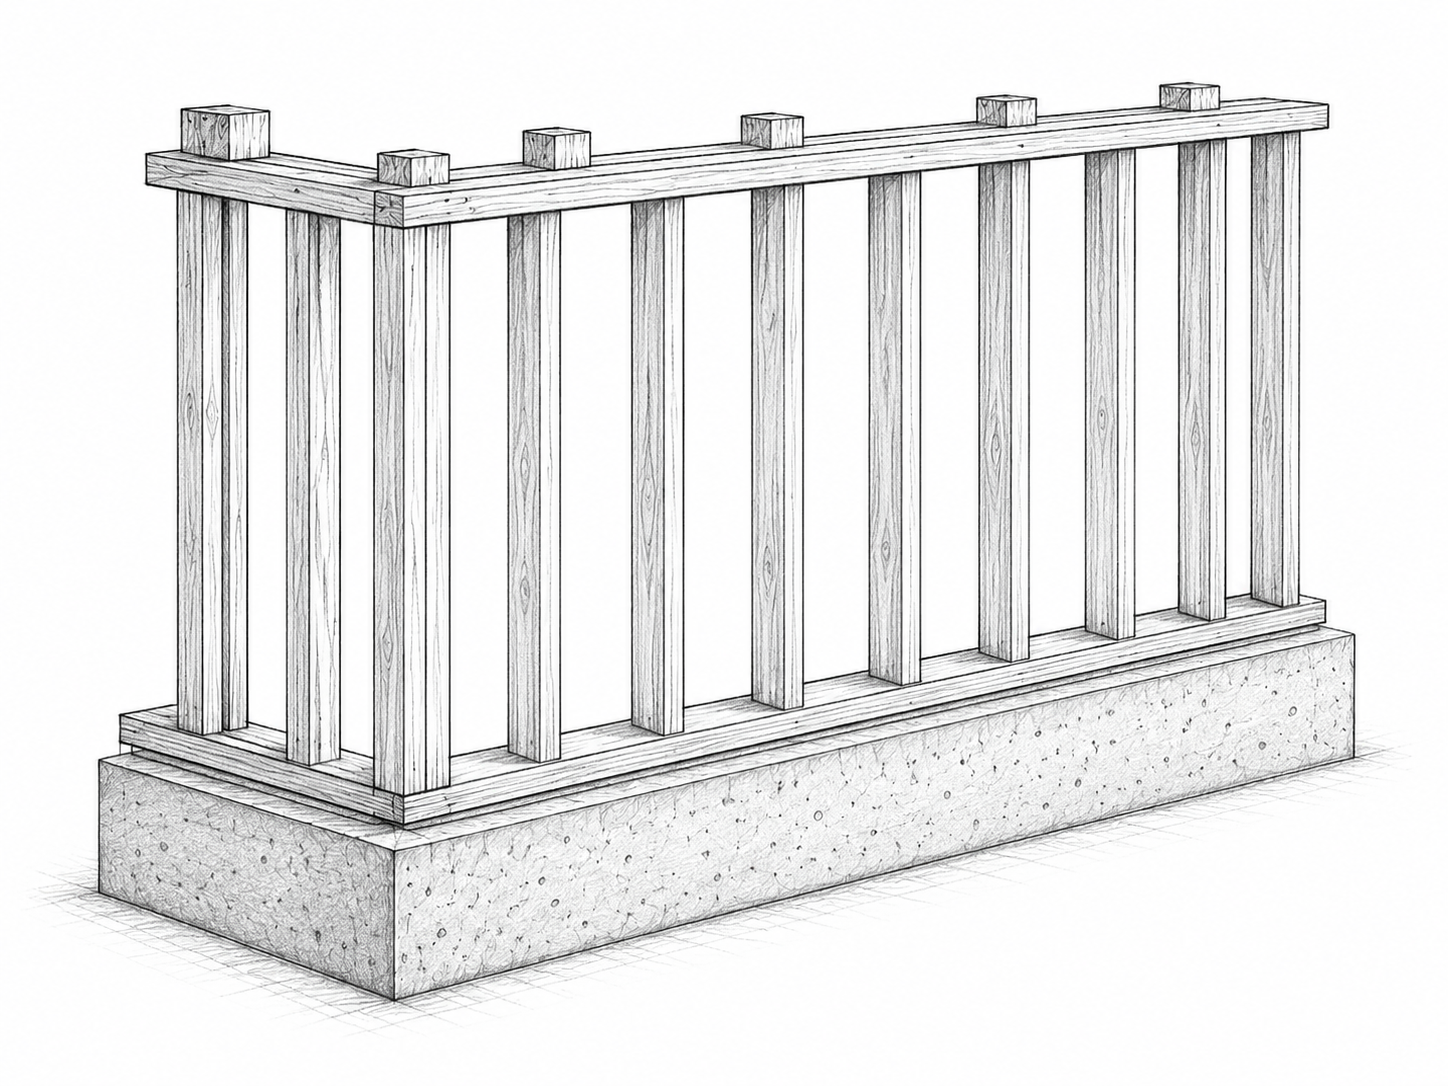
- Standard wood-frame home
- ~12,000 kWh/yr electricity use
- Full utility rates
MODELED ECONOMIC SCENARIOS
Illustrative annual electricity-cost comparisons across three building-system scenarios.
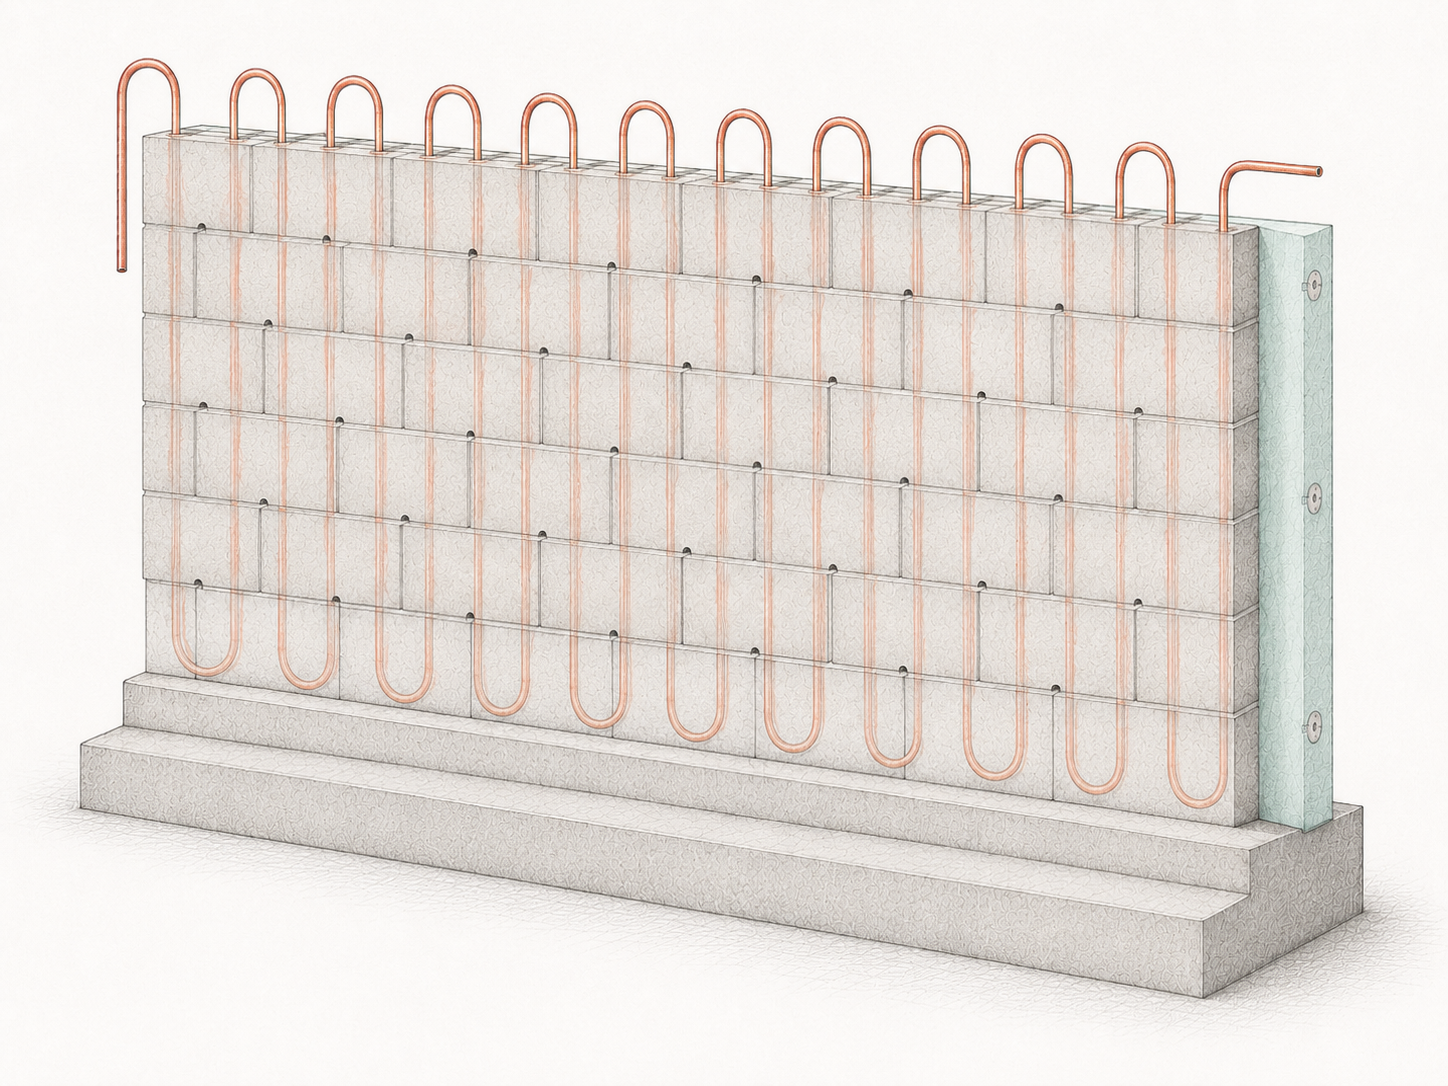
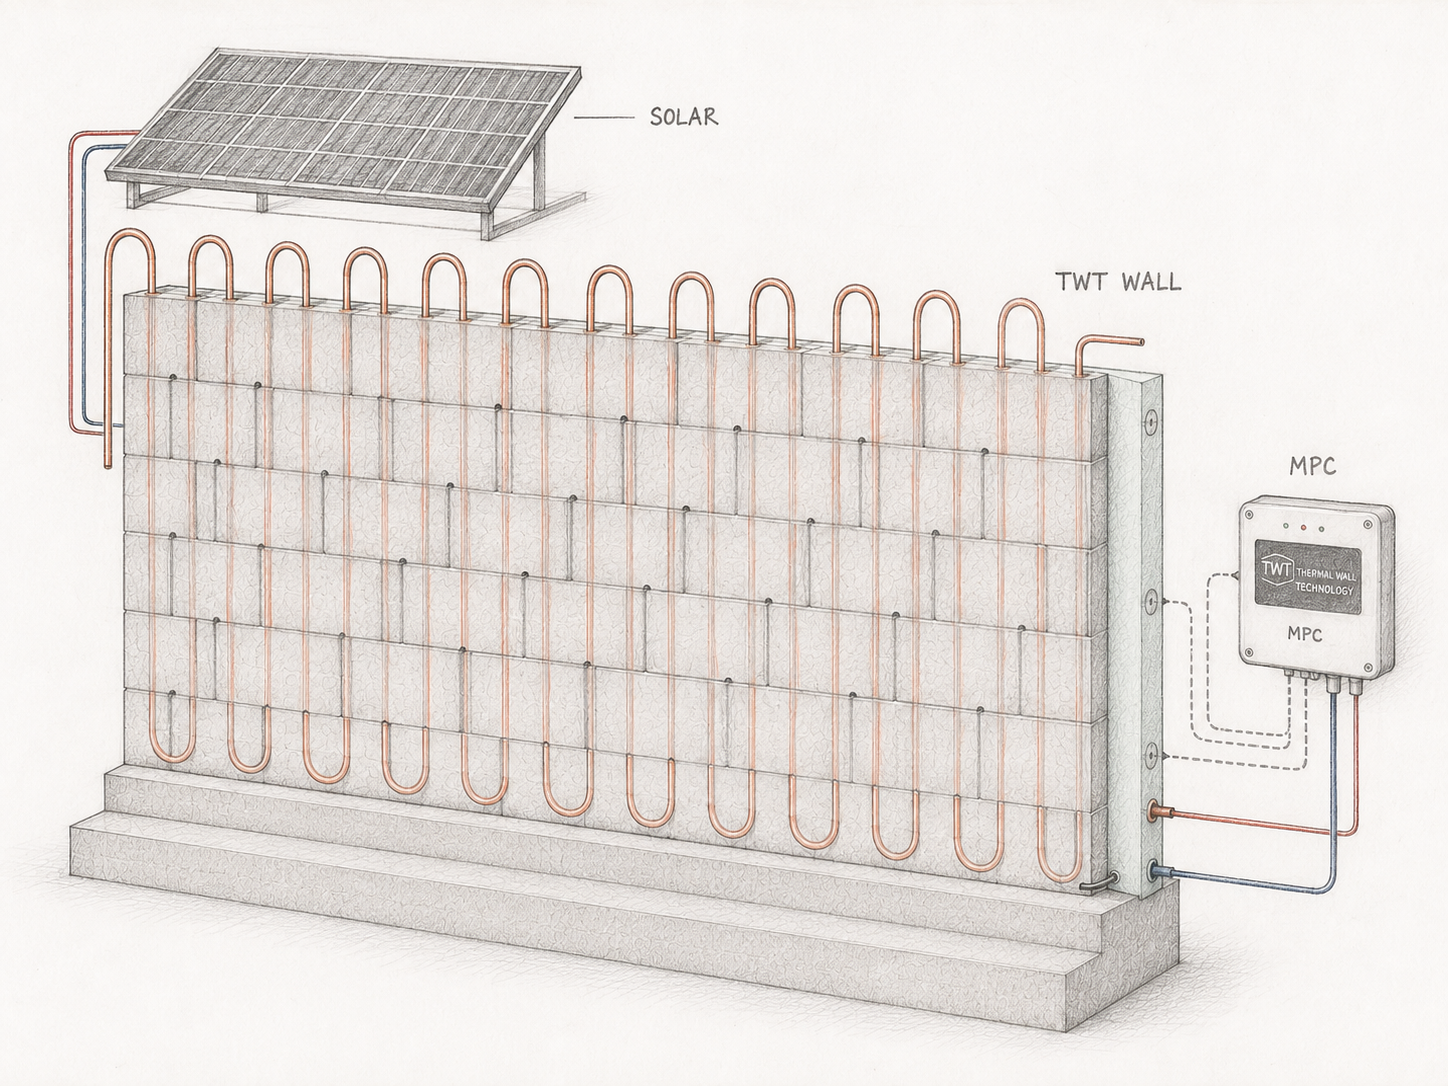
Modeled rate: 19.83¢/kWh (U.S. average residential)
Projected rate: 19.83¢/kWh
Annual electricity cost (USD)
All values in USD. Costs will vary with future electricity rates and conditions.
| Year | Modeled rate (¢/kWh) | Standard wood frame (~12,000 kWh/yr) | TWT + MPC RES (~2,200 kWh/yr off-peak eq.) | TWT + solar + MPC RES (~850 kWh/yr off-peak eq.) | Annual savings (solar TWT vs. wood frame) |
|---|---|---|---|---|---|
| 2030 | 19.83 | $2,380 / yr | $305 / yr | $118 / yr | $2,262 / yr |
| 2040 | 26.50 | $3,180 / yr | $408 / yr | $158 / yr | $3,022 / yr |
| 2050 | 35.50 | $4,260 / yr | $547 / yr | $211 / yr | $4,049 / yr |
| 2060 | 44.50 | $5,340 / yr | $685 / yr | $265 / yr | $5,075 / yr |
| 2070 | 58.00 | $6,960 / yr | $893 / yr | $345 / yr | $6,615 / yr |
Wood frameFull exposure to grid-price increases.
TWT + MPC RESLower load and off-peak shifting.
TWT + solar + MPC RESSolar thermal and minimal grid top-offs.
KEY MODEL ASSUMPTIONS
EXPLORE THE FULL ANALYSIS
Explore other climates, rate scenarios, and system configurations as the demonstration program develops.